Zabbix源码分析 -- Zabbix Server概貌介绍
2015-12-18
文档
Zabbix术语
Host相关:
host group: a logical grouping of hosts; it may contain hosts and templates. Hosts and templates within a host group are not in any way linked to each other. Host groups are used when assigning access rights to hosts for different user groups.
host: a networked device that you want to monitor, with IP/DNS.
template: a set of entities (items, triggers, graphs, screens, applications, low-level discovery rules, web scenarios) ready to be applied to one or several hosts. The job of templates is to speed up the deployment of monitoring tasks on a host; also to make it easier to apply mass changes to monitoring tasks. Templates are linked directly to individual hosts.
application: a grouping of items in a logical group.
item: a particular piece of data that you want to receive off a host, a metric of data.
trigger: a logical expression that defines a problem threshold and is used to "evaluate" data received in items. When received data are above the threshold, triggers go from 'OK' into 'Problem' state. When received data are blow the threshold, triggers stay in/return to an 'OK' state.
graph: There are two kinds of graph: Simple graphs, Custom graphs. Simple graphs are provided for the visualization of data gathered by items. No configuration effort is required on the user part to view simple graphs. They are freely made available by Zabbix. Custom graphs, as the name suggests, offer customisation capabilities. While simple graphs are good for viewing data of a single item, they do not offer configuration capabilities. Thus, if you want to change graph style or the way lines are displayed or compare several items, for example incoming and outgoing traffic in a single graph, you need a custom graph. Custom graphs are configured manually. They can be created for a host or several hosts or for a single template.
discovery: Zabbix offers automatic network discovery functionality that is effective and very flexible; It is possible to allow active Zabbix agent auto-registration, after which the server can start monitoring them; Low-level discovery provides a way to automatically create items, triggers, and graphs for different entities on a computer.
web scenario: one or several HTTP requests to check the availability of a web site.
interface:
告警相关:
event: a single occurrence of something that deserves attention such as a trigger changing state or a discovery/agent auto-registration taking place.
action: a predefined means of reaching to an event. An action consistes of operations (e.g. sending a notification) and conditions (when the operation is carried out).
escalation: a custom scenario for executing operations within an action; a sequence of sending notifications/executing remote commands.
media: a means of delivering notifications; delivery channel.
notification: a message about some event sent to a user via the chosen media channel.
remote command: a pre-defined command that is automatically executed on a monitoted host upon some condition.
Zabbix Server配置文件与Zabbix Agent配置文件
zabbix_server.conf
官方参考文档:Daemon configuration: zabbix server
zabbix_agentd.conf
官方参考文档:Daemon configuration: zabbix agent(UNIX)
官方参考文档:Daemon configuration: zabbix agent(Windows)
zabbix_proxy.conf
官方参考文档:Daemon configuration: zabbix proxy
Zabbix Server数据库分析
下图是zabbix前端中Configuration --> Hosts的信息,从中可以看到我们能够为一个Host配置Applications, Items, Triggers, Graphs, Discovery, Web, Interface, Templates.

下面列出了与Host配置(Host, Applications,Items,Triggers,Graphs,Discovery,Web,Interface)相关的数据库表格、监控项目(Item)历史数据相关的数据库表格、用户信息相关的数据库表格。下面我只会介绍某一大类数据库表格下一些重要表格的结构、作用,以及重要表格之间的连接关系,而对其它的数据库表格只给出了数据库表名。
Host相关表格:
- hosts
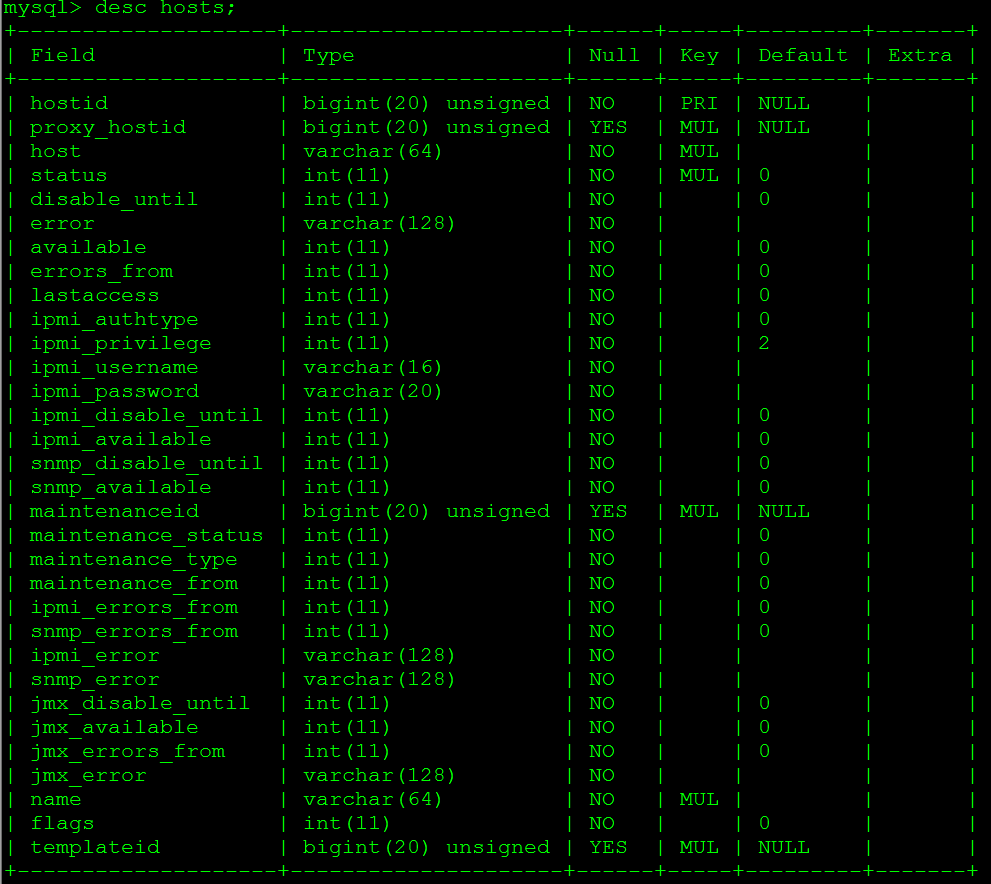
在zabbix中host和template有着不同的定义(见前面zabbix术语部分),但它们都包含Applications、Items、Triggers、Graphs、Screens、Discovery、Web、Linked templates(templates),可以说template就是zabbix事先定义好的host,所以在数据库的存储方面host和template的信息都存储在hosts表格中。 hosts表格及其重要,它记录了host几乎所有的信息,而其它比较重要的表格(applications、items、interface、httptest)是通过hosts表格中的hostid来关联上hosts表格的。
hosts_groups
host_inventory
hostmacro
hosts_templates
hosts_templates表格给出了host与template之间的链接关系。

- groups
Applications相关表格:
application是一个或多个item的集合,一个item可以属于一个或多个application。 一个template(host)可以包含一个或多个application,一个application可以属于一个或多个template(host)。
- applications
applications表格通过hostid关联了hosts表格,并指明了每个applicationid的name。

- application_template
没弄懂?

- items_applications
items_applications表格指明了一个application包含了那些item。

Items相关表格:
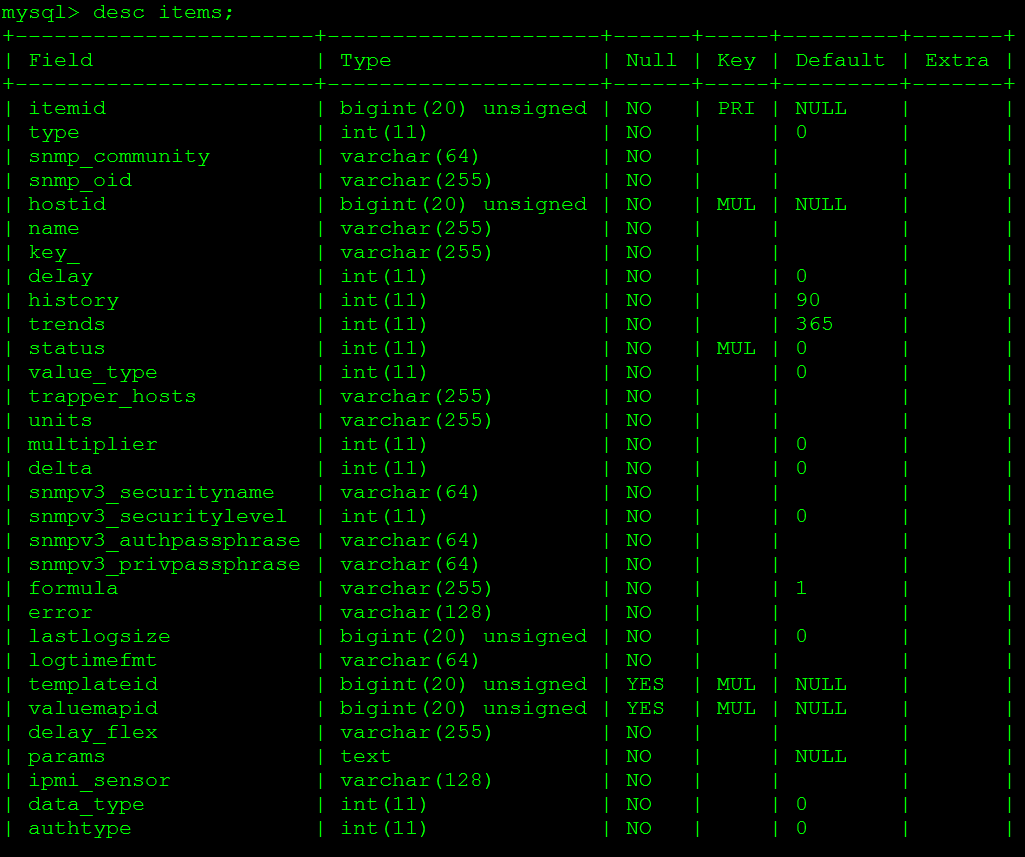
- items
items表格通过hostid关联了hosts表格,并有每个item的详细信息。
Triggers相关表格:
以下的表格都和告警相关
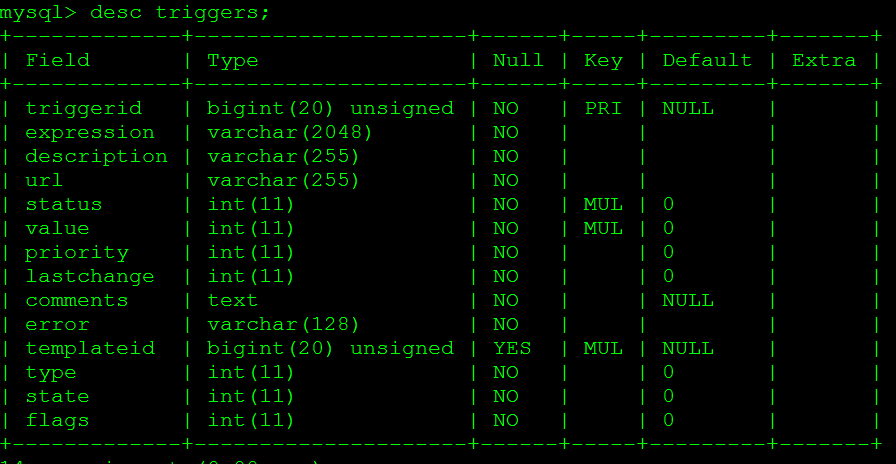
- triggers
triggers表格包含了所有触发器的详细信息。
- functions
functions表格通过itemid,triggerid将items表格和triggers表格关联了起来,并包含function的其它信息。

trigger_depends
actions
alerts
events
media
media_type
Graphs相关表格:
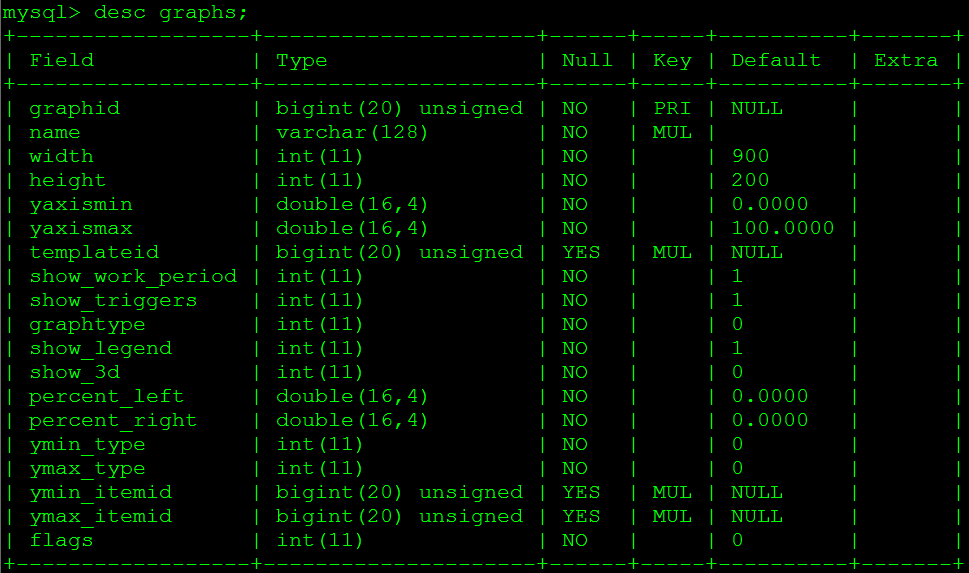
- graphs
graphs表格包含了zabbix中图形(graph)的详细信息。
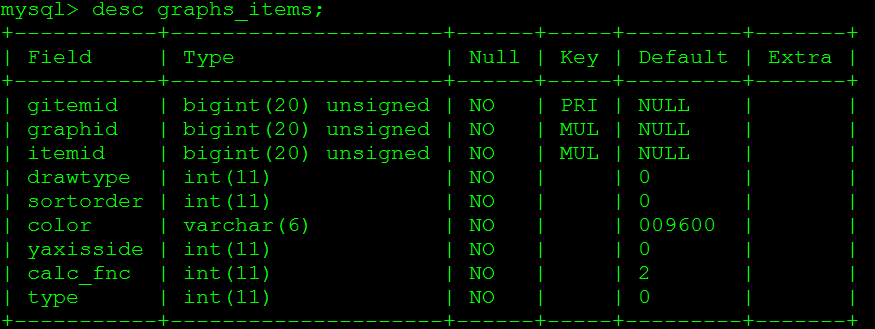
- graphs_items
graphs_items表格包含graphid、itemid两个字段,graphs和items就是通过这两个字段关联起来的。
- graph_theme
Discovery相关表格:
graph_discovery
group_discovery
host_discovery

interface_discovery
item_discovery
trigger_discovery
Web相关表格:
httpstep
httpstepitem
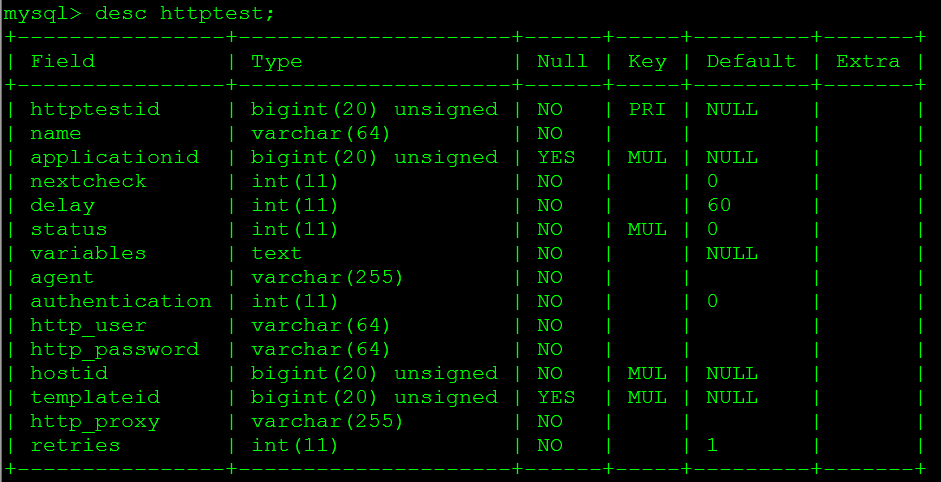
httptest
httptest表通过hostid与hosts表格关联,并包含web监控的其它相关信息。
- httptestitem
Interface相关表格:
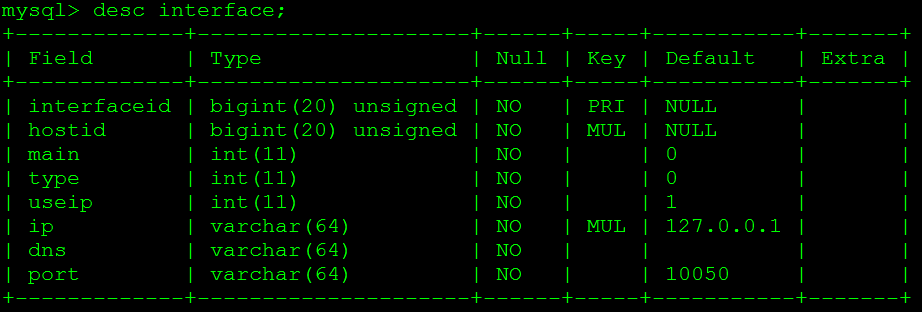
- interface
interface表通过hostid与hosts表格关联,并包含该host中代理的ip、端口号等。
Item history info相关表格:
- history
history表保存了zabbix server从各途径采集到的各监控项目(item)的历史数据,history_log、history_str、history_text、history_uint都是保存监控项目历史数据的,只是数据类型不同而已。

history_log
history_str
history_str_sync
history_sync
history_text
history_uint
history_uint_sync
Trend相关表格:
- trends
trends表保存了各监控项目(item)的趋势数据。

- trends_uint
用户信息相关表格:
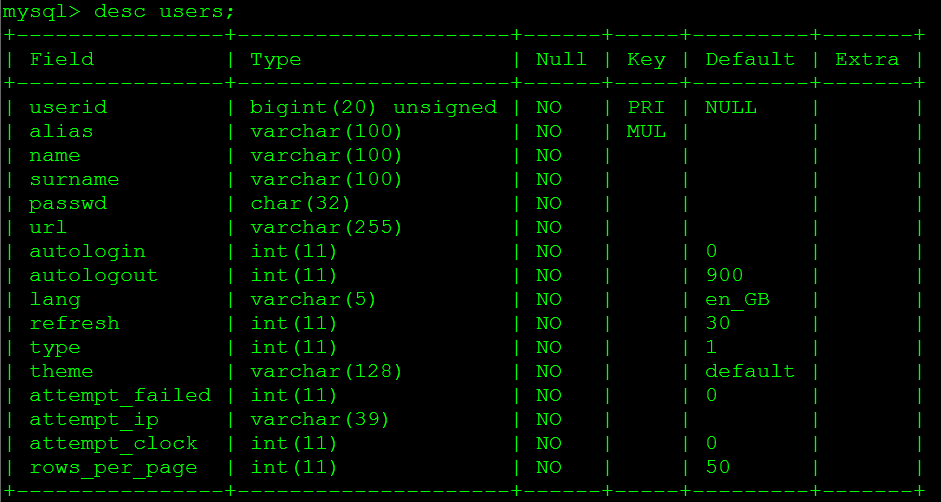
- users
users表保存了zabbix中的用户信息。
user_history
users_groups
usrgrp
config
profiles
rights
screens
screens_items
sessions
Zabbix Server各进程及其功能分析
Zabbix2.2.11 共有17个进程,它们大致的作用和关系如下图所示:
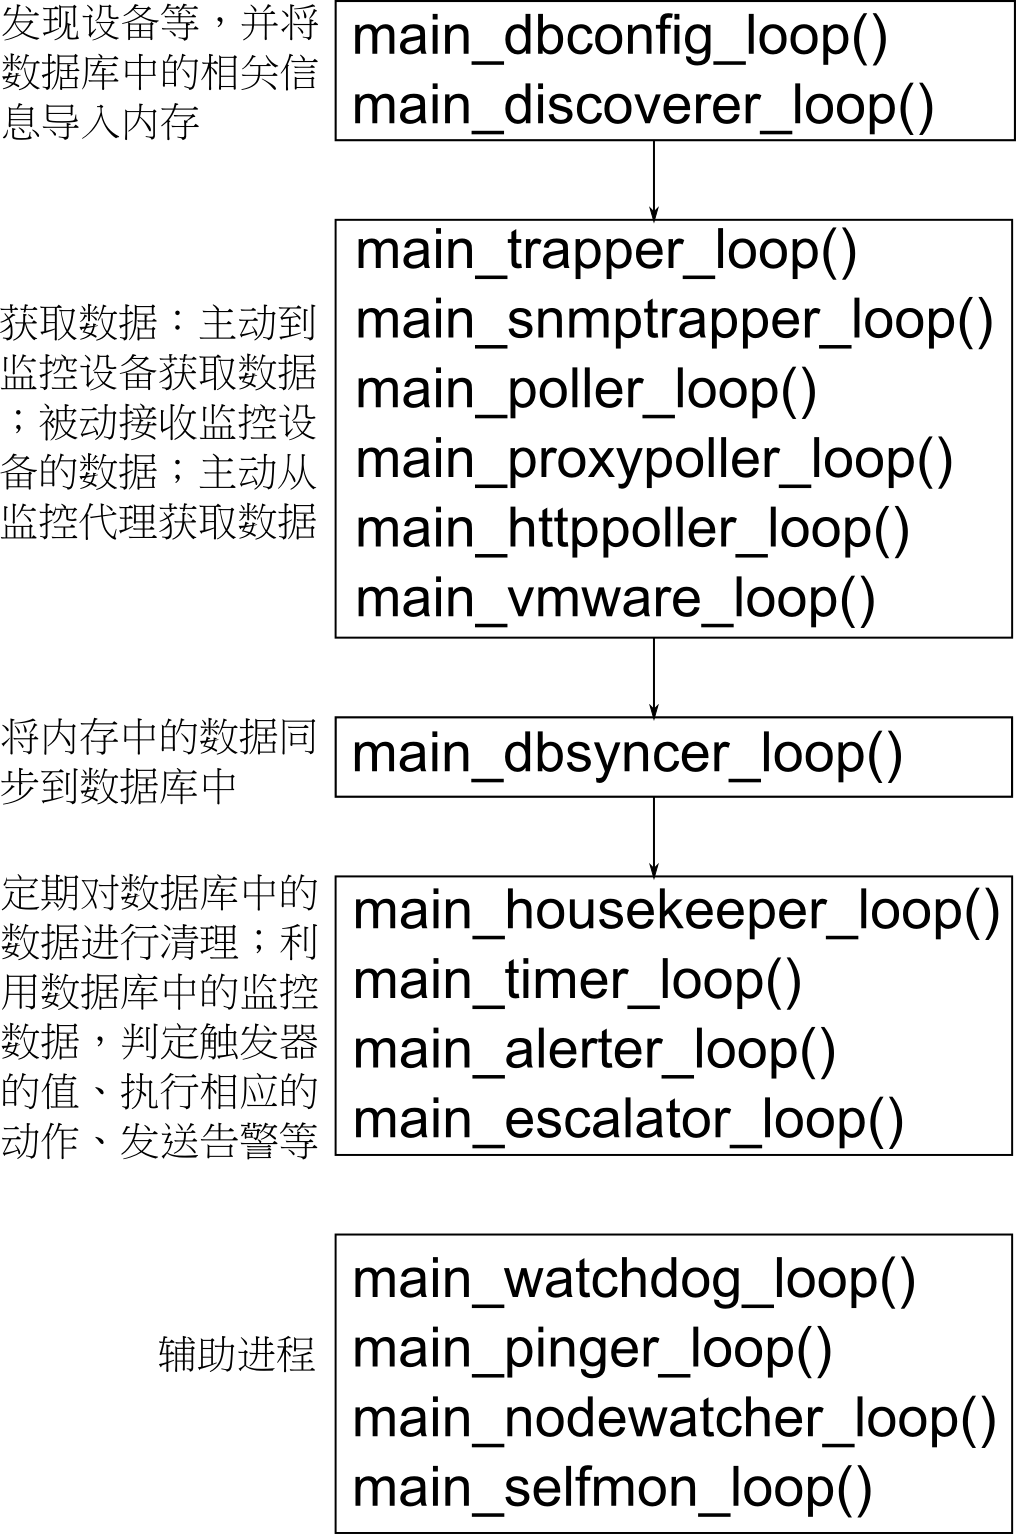
下面介绍各进程的功能,我会以如下的格式来说明各进程的功能:
进程名:
源码中的注释;
我自己的理解。
main_dbconfig_loop():
periodically synchronises database data with memory cache;
main_discoverer_loop():
periodically try to find new hosts and services;
main_trapper_loop():
periodically try to find new hosts and services;
main_snmptrapper_loop():
SNMP trap reader's entry point;
main_poller_loop():
None;
main_proxypoller_loop():
None;
main_httppoller_loop():
main loop of processing of httptest;
main_vmware_loop():
the vmware collector main loop;
main_dbsyncer_loop():
periodically synchronises data in memory cache with database;
main_housekeeper_loop():
None;
main_timer_loop():
periodically updates time-related triggers;
main_alerter_loop():
periodically check table alerts and send notifications if needed;
main_escalator_loop():
periodically check table escalations and generate alerts;
main_watchdog_loop():
check database availability every DB_PING_FREQUENCY seconds and alert admins if it is down;
main_pinger_loop():
periodically perform ICMP pings;
main_nodewatcher_loop():
periodcally calculates checksum of config data;
main_selfmon_loop():
comments powered by DisqusNone;